
Guide to Recipe Costing, Yield, and Food-Cost Percentage for Canadian Restaurants
TLDR
Most restaurant menus are priced by looking at what the place down the street charges and adding a little. That’s not costing. It’s guessing with extra steps, and it’s how dishes end up on the menu that lose money every time they sell.
Real costing starts with one plate. A standardised recipe card breaks a dish into every ingredient it contains, the protein, the starch, the sauce, the garnish, the oil it’s cooked in, priced against what you actually pay today. Add it up and you have the true cost to put that plate in front of a guest. Set the price off a target food-cost percentage and you’re pricing on arithmetic instead of instinct.
Then comes the correction almost everyone misses. The price on your invoice isn’t the price of the food you plate. A case of beef tenderloin costs one thing on the bill and a very different thing per usable portion once you’ve trimmed the silverskin, the chain, and the fat. That gap between as-purchased cost and edible-portion cost is where food-cost numbers quietly fall apart, and it’s worst on your most expensive proteins.
From there the article scales up: the three different ways to calculate food-cost percentage and what the gaps between them tell you, the costs that never appear on a recipe card but hit your kitchen anyway (the complimentary bread, staff meals, spillage, the heavy hand at the pass), and the re-costing rhythm that keeps all of it honest as supplier prices climb.
Cost one plate. Correct it for yield. Scale it to the whole kitchen. Fold in what you were missing. Keep it current. That’s a costed menu, and it’s the difference between a four per cent margin you planned and a four per cent margin you got lucky to see.
Why You Should Read the Full Article
The summary tells you the five moves. The article shows you how to make each one. It works a full recipe card from the plate up, runs the tenderloin yield test to the dollar so you can copy the method onto your own proteins, and lays out all three food-cost calculations with the formulas and a worked monthly example. It covers the costs that never reach a recipe card and how to fold them into your model, then builds the re-costing cadence that keeps a menu from going stale, backed by current StatCan, Bank of Canada, and Restaurants Canada figures on where food prices and margins actually sit. Inventory-heavy and prime-cost material that we’ve already covered in depth gets linked rather than repeated, so the piece stays on costing.
How Accountific Helps
Accountific works only with Canadian food businesses, so menu costing is something we do alongside the books rather than treat as a separate project. We help you build recipe cards that cost to the plate, convert invoice prices into edible-portion costs with proper yield factors, and set up your reporting so your theoretical food cost and your actual food cost sit side by side every period instead of once a year. When the two drift apart, you see it while there’s still time to act, and when a supplier price moves, you know which dishes it just put underwater. The result is a menu priced on arithmetic you can defend, feeding a margin you designed on purpose. Book a consultation directly with David at https://calendly.com/davidmonteith.
You picked your menu prices the way most operators do. You looked at what similar restaurants in your area were charging, landed somewhere in the same range, and adjusted by feel until the numbers looked reasonable. Maybe you aimed for roughly a third in food cost because that’s the rule of thumb everyone repeats.
Here’s the problem with pricing that way. You’ve set your prices based on someone else’s costs, someone whose suppliers, portion sizes, recipes, and waste you know nothing about. Your competitor’s $19 pasta might carry a $4 plate cost or a $9 one. You have no idea. And when you price off their number, you inherit a margin you never actually calculated.
That margin matters more in Canada right now than it has in years. Statistics Canada put the food services and drinking places sector’s operating profit margin at just 4.1 per cent in 2024, with cost of goods sold the single largest operating expense at 35.9 per cent of total expenses. On a margin that thin, a costing error that would be a rounding difference in another business is the difference between a profitable year and a loss.
Costing a menu properly runs the other direction from copying competitors. It starts with your ingredients, your portions, your prices, and builds up to a number that’s true for your kitchen. Once you have that, the menu price is a decision you make on purpose, not a hope you’re carrying.
Start with one plate: the standardised recipe card
Every costed menu is built one dish at a time, and the tool for it is the standardised recipe card. Not the recipe your chef cooks from. A costing version that lists every component of the dish with its exact quantity and its current price.
Take a burger you sell for $17. On the plate: a 150-gram beef patty, a brioche bun, a slice of cheese, lettuce, tomato, onion, a pickle, house sauce, a portion of fries, and the oil and seasoning that never make it onto anyone’s mental list. Cost each line against what you pay today.
The patty, at ground beef around $12 a kilogram, runs about $1.80. The bun, $0.65. Cheese, $0.35. The produce, maybe $0.40 all in. Pickle, $0.15. Sauce, $0.25. The fries portion, about $0.90. Oil and seasoning, call it $0.20. Add it up, and the plate costs roughly $4.70.
At a $17 menu price, that’s a food cost of about 27.6 per cent. That sits at the low end of the 28 to 35 per cent range the industry treats as healthy, against a full-service average the National Restaurant Association pegged at 32.4 per cent for 2026. But you only know where you stand because you built the number. Before the recipe card, “about a third” was a guess, and a guess that happened to be several points off would have quietly changed the economics of your best-selling item.
Do this for every dish on the menu. It’s tedious the first time and fast forever after, because a recipe card only changes when the recipe or the price changes. What you end up with is the true plate cost of everything you sell, which is the foundation for every other number in this article.
The trap in the invoice price: yield and edible-portion cost
Here’s where most recipe cards go wrong, even carefully built ones. They use the price on the invoice. And the invoice price is almost never the price of the food you actually plate.
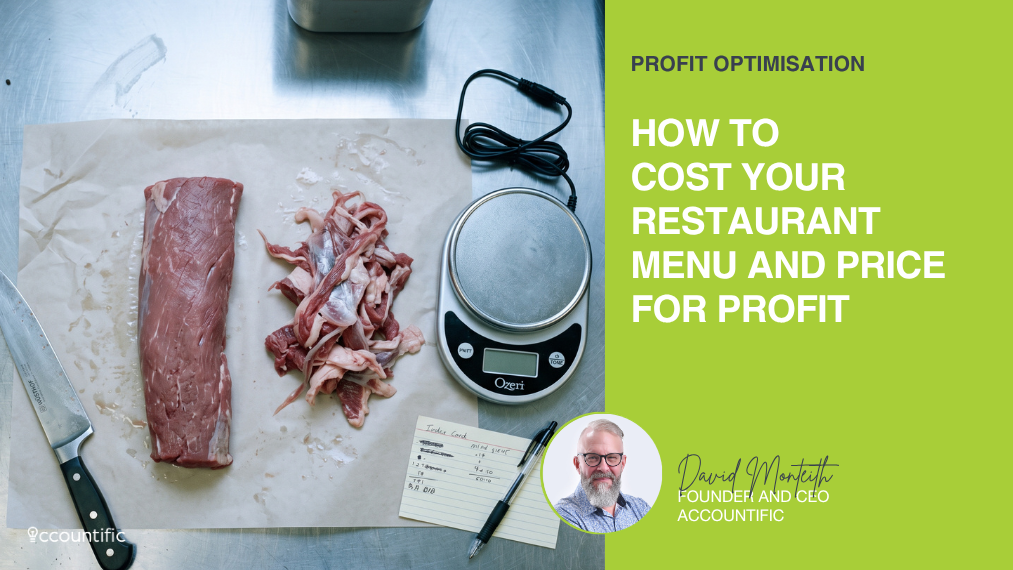
You buy a whole beef tenderloin. The case says 2.5 kilograms at $28 a kilogram, so $70. Simple. Except you don’t serve 2.5 kilograms. You trim the silverskin, pull the chain, cut away the fat and the tapered tail, and what’s left, the part you actually portion into steaks, might be 1.6 kilograms. The other 900 grams became trim.
So the real cost of what you plate isn’t $28 a kilogram. It’s $70 divided by 1.6 kilograms, which is $43.75 a kilogram. That’s the edible-portion cost, and it’s 56 per cent higher than the number on the invoice.
Now cost a 200-gram portion. Off the invoice price, you’d figure 0.2 times $28, or $5.60. The real cost is 0.2 times $43.75, or $8.75. If your recipe card used the invoice price, every steak you sell is $3.15 more expensive than your costing says, and your food-cost percentage on that dish is wrong by a wide margin.
The fix is a yield test. Weigh the raw product, prep it the way you actually prep it, weigh what’s usable, and the ratio is your yield percentage. Here, 1.6 divided by 2.5 is 64 per cent. From then on, your true cost per usable unit is the invoice price divided by the yield percentage. $28 divided by 0.64 gives you $43.75.
This matters most on exactly the ingredients you can least afford to misjudge: proteins, whole fish, and any produce with heavy trim or shrinkage. A case of romaine loses its outer leaves and cores. A salmon side loses skin, pin bones, and the belly trim. Every one of them costs more per plated gram than the invoice suggests, and the more expensive the ingredient, the more the gap hurts. With retail beef prices up 17 per cent in December 2025 over the prior year according to the Bank of Canada, getting the yield math right on your proteins isn’t optional anymore.
The price on your invoice is not the price of the food you plate. Trim, bones, and shrinkage mean your most expensive proteins cost far more per portion than the bill says, and that gap is where food-cost numbers quietly fall apart.
Three ways to read your food-cost percentage
Once you can cost a plate correctly, you can measure food cost across the whole kitchen. There are three ways to do it; they answer different questions, and most operators only ever see one of them.
The plate method builds up from your recipe cards. Take each dish’s plate cost, weigh it by how often the dish sells, and you get your theoretical food-cost percentage, what your food cost should be if every plate goes out exactly as costed. This is your target, the number the kitchen is capable of hitting on a perfect week.
The period method works from your actual spending. Take the food inventory you started the period with, add every food purchase, subtract the inventory you ended with, and you have the cost of the food you actually used. Divide by food sales for the same period. The formula is the industry-standard one: beginning inventory plus purchases minus ending inventory, over sales.
Say you opened the month with $18,000 in food inventory, bought $42,000, and counted $16,000 left at month end. You used $44,000 of food. Against $140,000 in food sales, that’s a period food cost of 31.4 per cent. This method depends entirely on counting inventory properly, which is its own discipline, and one we covered in The Inventory Mistake Bankrupting Profitable Restaurants.
The theoretical-versus-actual comparison is where the money hides. Your plate method said you should be running, say, 27 per cent. Your period method says you actually ran 31.4. That 4.4-point gap isn’t rounding. On $140,000 in sales, it’s about $6,160 in a single month that left your kitchen without becoming a sale.
That gap has a small number of usual causes: over-portioning, waste and spoilage, yield you didn’t account for, comps and remakes, and theft. Chasing it down is exactly the work we walked through for both food and bar in Preventing Theft and Waste in Restaurants. The point here is that you can’t even see the gap until you have both numbers, the theoretical from your recipe cards and the actual from your period count. One number on its own tells you almost nothing.
Cost the things that never hit a recipe card
Your recipe cards cost the food that goes onto the plate a guest ordered. But plenty of food leaves your kitchen without ever appearing on a printed recipe, and if you don’t account for it, your true food cost will always run higher than your costing predicts.
The complimentary bread basket and the chips and salsa that hit the table before anyone’s ordered. Free refills on soft drinks and coffee. Staff and shift meals. The dish that gets sent back and remade. The comp you send to a regular or an unhappy table. The pasta that’s plated with a heavy hand because the line was slammed and nobody weighed it. The tray of prep that spoiled because it got buried in the walk-in.
None of it is on a recipe card. All of it is real food cost.
You don’t need a recipe card for each of these, but you do need to fold them into your model. Track staff meals as their own line so you know what they cost you monthly. Log comps and remakes through your POS so they’re visible instead of vanishing. Portion with scales and portion tools at the pass, because “a handful” is the single most expensive measurement in any kitchen. The goal is that the food your theoretical costing can’t see still gets counted, so the gap between theoretical and actual shrinks to something you can explain.
A costed menu goes stale
Here’s the part that undoes all the work. You cost your entire menu beautifully at open, set your prices, print them, and never touch the costing again. Two years later, beef is up, cooking oil has swung twice, and that imported cheese you built a signature dish around is up double digits. The dish you think runs 30 per cent food cost is quietly running 44, and your printed menu price hasn’t moved.
A recipe card is a snapshot of costs on the day you built it. Ingredient prices don’t sit still, and they’ve moved faster and less predictably than most operators have ever had to manage. Canada’s Food Price Report forecast overall food prices rising 3 to 5 per cent for 2025, and grocery prices have climbed around 22 per cent since 2022 on Bank of Canada figures. A costed menu you don’t maintain is worth less every month.
The fix is a re-costing rhythm. Re-cost your highest-volume and highest-cost dishes at least quarterly, because those are the plates where a cost swing moves your whole margin. Set a rule that any time a key ingredient moves past a threshold you choose, say five or eight per cent, the dishes built on it get re-costed right away. And build a simple flag: when a dish crosses its target food-cost percentage, it goes on a list for action.
Action doesn’t always mean raising the price. Sometimes you re-portion, bringing a plate back to the size it was costed at. Sometimes you re-cost because a substitute ingredient is cheaper and just as good. Sometimes you adjust a garnish or a side that was quietly inflating the plate. And sometimes, yes, the price moves. The decision is yours, but you can only make it if the costing is current. This is the food-cost half of the prime-cost discipline we broke down in Why Your Restaurant POS System Is Lying to You About Your Actual Sales, and it feeds directly into how cleanly your costs read in your accounts, which we covered in Where Your Restaurant Profits Are Leaking, And How to Plug the Gaps.
Where this leaves you
A costed menu is five moves. Cost one plate to the dollar with a standardised recipe card. Correct that cost for yield, so you’re pricing the food you plate and not the food on the invoice. Scale it across the kitchen with the three food-cost methods, and read the gap between theoretical and actual. Fold in the costs that never hit a recipe card. Then keep the whole thing current as prices move.
Do that, and the 4.1 per cent margin the average Canadian restaurant runs on stops being something you hope for at the end of the month and starts being something you designed at the start of it. Pricing by gut is how good restaurants with full dining rooms still can’t make payroll. Costing is how you make sure a busy night is also a profitable one.
Key Takeaways
- Pricing off what competitors charge inherits a margin you never calculated. Costing builds the price up from your own ingredients, portions, and prices.
- A standardised recipe card costs every component of a dish, including the oil, seasoning, and garnish most operators forget, to give you a true plate cost.
- The invoice price isn’t the plate price. Yield tests convert as-purchased cost into edible-portion cost, which runs far higher on trimmed proteins and produce.
- Cost per usable unit equals the invoice price divided by the yield percentage. A 64 per cent yield turns $28/kg into $43.75/kg.
- Food-cost percentage has three readings: theoretical (from recipe cards), actual (from inventory counts), and the variance between them, which reveals waste, over-portioning, and theft.
- Complimentary items, staff meals, comps, spillage, and over-portioning are real food costs that never appear on a recipe card and must be folded into your model.
- A costed menu goes stale as supplier prices move. Re-cost high-volume and high-cost dishes quarterly, and immediately when a key ingredient crosses a price threshold.
Frequently Asked Questions
What is a standardised recipe card?
A standardised recipe card is a costing document that lists every ingredient in a dish with its exact quantity and current price, including small items like oil, seasoning, and garnish. Added together, it gives you the true cost to plate that dish. It differs from a kitchen recipe, which tells cooks how to prepare the dish. The costing card exists to tell you what the dish costs and, from there, what to charge for it.
How do I calculate food-cost percentage?
There are three methods. The plate method weights each dish’s recipe-card cost by how often it sells to give a theoretical target. The period method takes beginning inventory plus purchases minus ending inventory, divided by sales, to give your actual food cost for a stretch of time. The theoretical-versus-actual comparison measures the gap between the two, which shows how much food left your kitchen without becoming a sale. You need all three to see the full picture.
What’s the difference between as-purchased cost and edible-portion cost?
As-purchased cost is the price on your invoice. Edible-portion cost is what the usable food costs after you’ve trimmed, peeled, or otherwise prepped it, and lost weight in the process. A tenderloin bought at $28 a kilogram that yields 64 per cent usable product actually costs $43.75 a kilogram to plate. Costing off the invoice price rather than the edible-portion cost understates your food cost, badly on heavily trimmed proteins.
How do I do a yield test?
Weigh the raw product before prep. Prep it exactly the way your kitchen normally does, trimming, peeling, portioning. Weigh what’s left that you can actually serve. Divide the usable weight by the starting weight to get your yield percentage. From then on, your true cost per usable unit is the invoice price divided by that yield percentage. Run yield tests on any ingredient with significant trim or shrinkage.
What food-cost percentage should a restaurant aim for?
The industry treats 28 to 35 per cent of food sales as the healthy range, and the National Restaurant Association put the full-service average at 32.4 per cent for 2026. The right number still depends on your concept, your pricing, and your labour model. Rather than chase a universal figure, cost your own plates, set a target that supports your overall margin alongside labour, and measure your actual food cost against it every period. The target matters less than knowing whether you’re hitting the one you set.
Why is my actual food cost higher than my recipe cards say it should be?
The gap between theoretical food cost (what your recipe cards predict) and actual food cost (what your inventory counts show) comes from a handful of sources: over-portioning at the pass, waste and spoilage, yield loss you didn’t cost for, comps and remakes, and theft. A gap of a few percentage points can mean thousands of dollars a month on a mid-sized sales base. Closing it starts with measuring both numbers, then working through the causes one at a time.
How often should I re-cost my menu?
Re-cost your highest-volume and highest-cost dishes at least quarterly, since those are where an ingredient price swing moves your margin the most. On top of that, re-cost any dish immediately when a key ingredient crosses a price threshold you set, for example a five to eight per cent move. A menu costed once at opening and never revisited drifts further from reality every month as supplier prices change, and with food prices climbing well into double digits since 2022, that drift adds up fast.
Do complimentary items and staff meals count as food cost?
Yes. Any food that leaves your kitchen is a real cost, whether or not a guest paid for it. Complimentary bread, free refills, staff and shift meals, comps, remakes, and spoilage all consume product your recipe cards don’t capture. Track them, ideally as their own lines, so your true food cost reflects everything you actually used, not just the plates that were ordered and paid for.
Costing a menu is only useful if the numbers stay live, and that’s the part most operators can’t keep up with on their own. Accountific works exclusively with Canadian food businesses, so we sit close to the kitchen side of the books. We turn your supplier invoices into real edible-portion costs, hold your recipe cards against what your inventory counts actually say, and flag the dishes slipping past their target the moment an ingredient price moves rather than at year-end. You end up knowing which plates earn their place on the menu and which ones are quietly costing you, with pricing you can stand behind. Book a consultation directly with David at https://calendly.com/davidmonteith.
David Monteith, founder of Accountific, is a seasoned digital entrepreneur and a Xero Silver Partner Advisor with over three decades of business management and financial expertise. He specialises in providing tailored Xero solutions for food and beverage businesses, streamlining accounting processes and delivering valuable financial insights that drive client success. David also serves as CFO of Great Work Online, a digital marketing agency serving food and beverage businesses, where he leads budgeting, financial oversight, and business management. This dual perspective gives Accountific clients more than bookkeeping mechanics — it brings a strategic view of how financial systems support better decisions, stronger operations, and long-term growth.