
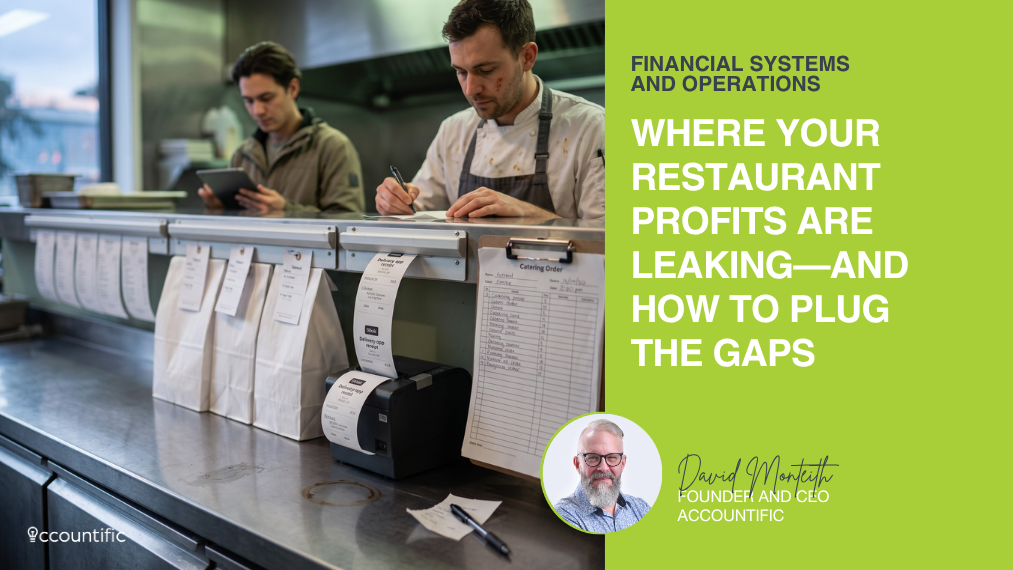
Stop Guessing Where Your Profits Go: The Channel-Segmented Chart of Accounts
TLDR
You did $100,000 in sales last month. You did $100,000 this month. Nothing changed, so nothing’s wrong.
Except dine-in fell $20,000, and delivery picked up the same $20,000. Delivery takes 15 to 30 percent in commission, and the alcohol those dine-in guests would have ordered, running a 70 percent gross margin, never made it onto a single delivery ticket. Same top line, thousands of dollars gone, and your revenue report shows you none of it.
That’s what a single “Sales” account does to a restaurant. Most operators now run four or five businesses under one roof, dine-in, takeout, third-party delivery, direct delivery, catering, and every one of them carries a different margin. Collapse them into one line, and you lose the ability to see which channel is carrying you and which one is quietly bleeding you.
The fix is structural. Split revenue into its own lines in the 4000 range and mirror the costs in the 5000 range, so each channel becomes its own miniature P&L. Operators who do this usually find at least one channel sitting at or below break-even. Delivery is the common answer. Catering is the surprising one, because a big contract posts as revenue while the invoice sits in receivables for 30 to 60 days, and payroll is still on Friday.
The article works through the rest of the leak map: prime cost and the four menu-engineering categories, sales per labour hour and why flat staffing across a six-hour service dilutes profit, the payroll remittance schedules and the penalty matrix that turns a $15,000 remittance eight days late into a $1,500 fine, GST/HST filing deadlines and the compounding late-filing formula, the accrual illusion buried in gift cards and catering deposits, and the liquidity ratios that flag a cash crisis before it lands.
The numbers behind all of it are ugly. Sector bankruptcies rose 30 percent in 2024. By mid-2025, roughly 41 percent of Canadian food businesses were operating at a net loss or breaking even. Average operating margin sat at 3.6 percent. There’s no room left for guessing.
Why You Should Read the Full Article
The summary tells you the leak exists. The article shows you where. It lays out the full account-numbering architecture for a channel-segmented chart of accounts, the COGS formula and the inventory maths behind prime cost, the four menu categories and what to do with each one, the CRA remitter thresholds and the exact penalty percentages by days late, the GST/HST installment schedule and the trap that catches sole proprietors every year, the tax timing on catering deposits, and the liquidity table with target ranges and crisis thresholds for Current Ratio, Quick Ratio, inventory turnover, gross margin, and net margin.
How Accountific Helps
Accountific works exclusively with Canadian food businesses. We build the segmented ledger, integrate it with your point-of-sale so transactions map themselves, handle the payroll and the tax compliance, and get you weekly numbers instead of month-old guesses. Book a consultation directly with David at https://calendly.com/davidmonteith.
Your Sales Are Up. So, Why Is Your Bank Account Flat?
You operate a complex business requiring your attention on hundreds of moving parts every single day. You manage staff, you negotiate with suppliers, and you deliver exceptional culinary experiences to your guests. You are a master of food and hospitality. You are not a master of spreadsheets. Financial administration causes severe stress and steals valuable hours away from running the dining room floor. Most operators manage their businesses relying heavily on gut feel. Operating a hospitality business without clear numbers leads directly to failure.
You lack a current, up-to-the-minute understanding of true profitability. You lack clear cash flow visibility. You do not know the precise financial performance of individual menu items. Strategic decision-making becomes incredibly difficult without accurate data. Compliance fears keep you awake at night. You worry about missing tax deadlines. You fear making costly calculation errors. You dread facing severe financial penalties from the Canada Revenue Agency. Managing payroll, issuing T4 slips, and filing Records of Employment represent a complex, time-consuming burden. This administrative weight distracts you from core business operations.
Accountific solves these pains directly. We are not generalists. We live and breathe restaurant finances. We provide weekly bookkeeping, ensuring you always possess a current, accurate picture of your financial health. This continuous service enables agile, proactive decision-making. We operate as a comprehensive, one-stop shop for the big three administrative burdens: bookkeeping, payroll, and tax compliance. This consolidated approach gives you one trusted partner and complete peace of mind. We do not simply organise numbers. We help turn raw data into actionable insights, translating point-of-sale data into advanced menu engineering reports. The ultimate outcome equals control. We give you the financial clarity you need to build a stable, thriving business and reclaim your work-life balance.
The Economic Reality Facing Food Businesses in Canada
The Canadian food and beverage sector faces an unprecedented economic environment characterised by shifting consumer expenditures, persistent inflation, and escalating operational costs. Following a brief period of post-pandemic recovery, the industry exhibits signs of significant financial strain. Financial analysts observe a surge in corporate insolvencies within the sector, with bankruptcies increasing by 30 per cent throughout 2024. By the middle of 2025, approximately 41 per cent of domestic food businesses operated at a net loss or managed to merely break even. These figures highlight a fundamental instability within standard operational models.
Top-line revenue metrics present a complex narrative. Sales in fast-food or quick-service restaurants reached $44.8 billion in 2024, representing an increase of $2.3 billion from the previous year. Full-service restaurant sales experienced a smaller increase of $895.5 million, reaching $41.6 billion during the same period. Every province recorded growth in the fast-food industry, led by Quebec with a 6.2 per cent increase, British Columbia with a 6.0 per cent increase, and Ontario with a 5.5 per cent increase. Limited-service establishments commanded 46.4 per cent of total sector sales, while full-service operations held 43.1 per cent.
Despite these nominal gains, underlying economic fundamentals signal severe headwinds. Commercial foodservice sales experienced an initial 6.9 per cent rise in early 2025, primarily driven by a temporary tax holiday and a surge in domestic tourism. Forecasts for 2026 present a much more conservative outlook, projecting a mere 2.3 per cent growth rate. This downward revision stems from a notable decline in consumer confidence and widespread reductions in household discretionary spending. Survey data indicate 74 per cent of consumers actively reduced non-essential expenditures during the year, with dining out and restaurant delivery serving as the primary targets for budget cuts.
Operators recognise shifting value perceptions among consumers. Currently, only 11 per cent of diners believe fast food offers adequate value for money. Menu prices continue to rise faster than median wages, forcing patrons to re-evaluate the affordability of routine dining habits. The average transaction value per restaurant visit reached $63, representing a 12.5 per cent year-over-year increase from the $56 average recorded in 2023. While diners spend more per visit, overall foot traffic relies increasingly on promotional incentives and value-driven menu engineering. Value propositions remain the primary driver for 88 per cent of consumers, though 68 per cent simultaneously prioritise healthy and locally sourced ingredients.
The Revenue Illusion and the Delivery App Paradox
The proliferation of digital ordering platforms permanently altered the distribution of restaurant revenue streams. Historically, establishments relied primarily on on-premises dining. Contemporary business models depend on a diversified mix of dine-in, takeout, third-party delivery, direct delivery, and retail merchandising. While e-commerce sales as a proportion of total food sales saw a minor decline to 9.8 per cent in 2022 as consumers temporarily returned to physical dining rooms, this figure remained 117.2 per cent higher than pre-2020 levels.
Online food delivery platforms represent a massive growth vector. Nationwide revenue generated from digital food delivery reached $18.99 million USD in 2024. Projections indicate this specific channel will generate $28.64 million USD by 2030, representing a 51 per cent expansion over a six-year period. Third-party websites facilitate 62.4 per cent of these digital transactions, while mobile applications account for 52.4 per cent. More than 70 per cent of consumers regularly order takeout, heavily driven by younger demographic cohorts. Specific application usage remains high, with 54 per cent of the population utilising Uber Eats and 49 per cent ordering through DoorDash annually.
This digital transition introduces severe margin compression. Third-party delivery platforms routinely exact commission fees ranging from 15 per cent to 30 per cent per transaction. Establishments operating on razor-thin net margins often fulfill delivery orders at a net loss to maintain market share. The transition to off-premises dining also eliminates highly profitable secondary purchases. Alcohol sales, carrying gross profit margins up to 70 per cent, rarely translate to digital delivery orders due to regulatory restrictions and logistical complexities.
The industry response involves a delicate balancing act. Statistics Canada data shows 30 per cent of full-service operators and 40 per cent of limited-service operators actively reconfigured interior dining spaces or exterior parking facilities to accommodate the surge in off-premises volume. For limited-service establishments, off-premises traffic currently accounts for 83 per cent of all transactions, a notable increase from 76 per cent five years prior. Full-service restaurants saw their off-premises volume grow from 19 per cent to 30 per cent over the same timeline. Integrating these varied revenue streams requires sophisticated financial tracking mechanisms to prevent unprofitable channels from destroying successful operations.
Designing the Ultimate Financial Command Centre
Accurate financial analysis depends entirely on the structural integrity of the general ledger. The Chart of Accounts serves as the foundational architecture for all bookkeeping, payroll, and tax compliance activities. A standard, unsegmented Chart of Accounts proves wholly inadequate for modern food and beverage operations. Traditional bookkeeping methods often lump all incoming funds into a single generic “Sales” or “Revenue” category. This basic approach obscures critical operational data. If third-party delivery sales decline while in-house dining increases, a consolidated revenue line merely displays flat growth, hiding both the vulnerability and the opportunity.
Imagine you generate $100,000 in sales this month. Last month, you generated $100,000. The revenue looks stable. In reality, dine-in sales dropped by $20,000. Delivery app sales increased by $20,000. Delivery apps charge 30 per cent commissions. You lost 30 per cent of the profit on a massive revenue swing. Your bank account shrinks rapidly. You have no idea why. A segmented chart of accounts prevents this blindness.
Financial strategists advocate strict segmentation of revenue channels. By designing the Chart of Accounts to separate dine-in, takeout, delivery, catering, and retail merchandise into independent ledger lines, you can evaluate the profitability of each source. This segmentation maps perfectly to the cost side of the ledger. When Cost of Goods Sold and direct labour expenses correspond to matching revenue channels, each stream functions as an independent, miniaturised Profit and Loss statement.
Standard account numbering conventions facilitate clear communication between business owners, bookkeepers, and tax authorities. Assets occupy the 1000 to 1999 range, encompassing cash, accounts receivable, inventory, and prepaid expenses. Liabilities reside in the 2000 to 2999 range, tracking accounts payable, credit card balances, tax obligations, and payroll liabilities. Equity accounts use the 3000 to 3999 range.
Revenue segmentation occurs within the 4000 to 4999 range. A properly structured restaurant ledger divides this section meticulously. You establish distinct lines for Dine-In Food Sales, Dine-In Beverage Sales, Takeout Sales, Third-Party Delivery Sales, Direct Delivery Sales, and Catering Revenue. Cost of Goods Sold, occupying the 5000 to 5999 range, mirrors this structure perfectly. You create specific lines for Cost of Food, Cost of Beverages, Packaging for Delivery, and Catering Supplies. Operating expenses sit in the 6000 to 6999 range, covering rent, utilities, marketing, and detailed labour breakdowns.
| Account Range | Classification | Channel-Segmented Sub-Accounts |
| 1000 – 1999 | Assets | Cash, POS Clearing, Food Inventory, Beverage Inventory |
| 2000 – 2999 | Liabilities | Accounts Payable, GST/HST Payable, Payroll Liabilities |
| 3000 – 3999 | Equity | Common Shares, Retained Earnings, Owner Draws |
| 4000 – 4999 | Revenue | Dine-In Sales, Delivery App Sales, Catering Income |
| 5000 – 5999 | Cost of Goods Sold | Direct Food Costs, Direct Beverage Costs, Delivery Packaging |
| 6000 – 6999 | Operating Expenses | Labour (Front of House/Back of House), Rent, Utilities, Marketing |
Setting this architecture correctly during the initial design phase ensures all downstream reporting inherits absolute clarity. When point-of-sale systems integrate seamlessly with cloud-based accounting software, transactions automatically map to the correct segmented accounts. This integration eliminates manual data entry errors and provides continuous, real-time financial visibility.
Deconstructing Prime Costs and Inventory Mathematics
Profitability within the hospitality sector relies on meticulous control over Prime Costs, defined as the sum of Cost of Goods Sold and total labour expenditures. The Cost of Goods Sold formula requires precise inventory tracking. You add the Beginning Inventory value to total Purchases, then subtract the Ending Inventory value to determine the total cost for the measured period. Dividing this figure by total sales yields the cost percentage. Successful establishments rigorously separate food costs from beverage costs to identify precise areas of waste or pricing inefficiency.
Perishable inventory introduces significant complexity. Fresh produce, meats, and dairy products possess short shelf lives, requiring precise demand forecasting to prevent spoilage. Food waste represents a massive financial drain, directly eroding gross profit margins. Environmental studies show food waste from the hospitality sector contributes 12 percent of the national total, generating potent methane emissions in landfills. Implementing rigorous First-In, First-Out inventory management protocols minimises this spoilage and prevents capital from remaining trapped on walk-in cooler shelves. Learning to use strategic waste management protocols yields substantial savings.
A healthy gross profit margin typically rests near 70 per cent, meaning ingredient costs consume 30 per cent of the revenue generated. Achieving this target requires continuous menu engineering. Financial analysts classify menu items into four distinct categories based on empirical sales data. Stars feature high profitability and high popularity; you must protect the quality and visibility of these items. Puzzles generate high profit but suffer from low sales volume; you solve this issue by altering menu descriptions or training staff to recommend the dishes. Plow Horses command high popularity but yield low profit margins; careful portion reduction or incremental price increases correct the imbalance. Dogs possess low popularity and low profitability, requiring immediate removal from the menu to eliminate ingredient waste and streamline kitchen prep times.
Does your menu say “Steak and Potatoes” or “8oz AAA Alberta Sirloin with Duck-Fat-Roasted Fingerling Potatoes and a Red Wine Jus”? One is a basic list. The other is a compelling story making mouths water. You must engineer the menu using data to drive sales toward high-margin items.
Despite achieving a 70 per cent gross margin, the final net profit margin remains precarious. Full-service establishments typically generate net margins between 3 per cent and 5 per cent. Quick-service formats observe slightly higher net margins between 6 per cent and 9 per cent. In 2023, the sector average operating profit margin dropped to a mere 3.6 per cent. Rising commodity prices force continuous adjustments. Nearly 79 per cent of operators attribute inventory challenges to tariffs and trade restrictions, resulting in a 37 per cent average increase in procurement costs. Maintaining profitability under these conditions demands absolute financial clarity and rapid, data-driven pricing responses.
Labour Economics and Strategic Staffing Ratios
Labour expenditures represent the second half of the Prime Cost equation and stand as a primary threat to operational solvency. Nearly 44 per cent of operators identify overall labour costs as their most significant staffing challenge. Analysing sales velocity through the Sales Per Labour Hour metric provides essential guidance for scheduling. Point-of-sale data often reveals steep revenue curves during a shift. A six-hour dinner service frequently generates the vast majority of revenue within a narrow two-hour window. Flat, unchanging staffing levels throughout the entire six hours guarantee severe profit dilution. You use detailed data to deploy staff in direct correlation with anticipated transaction volume.
Workforce instability compounds these financial pressures. The hospitality sector experiences notoriously high employee turnover rates. Replacing a single hourly employee costs an establishment upwards of $2,300 in lost productivity, training time, and administrative overhead. Retaining experienced personnel acts as a vital financial defence mechanism.
Designing compliant employee incentive programs presents a solution, provided the financial structures satisfy regulatory requirements. Effective programs fund themselves exclusively through the incremental profit generated by the incentivised behaviour. Rewarding staff for pushing specific, high-margin items creates a mutually beneficial scenario for the business, the employee, and the patron. Micro-bonuses awarded immediately following a successful shift prove significantly more effective for morale than delayed, annualised structures.
Compliance with government guidelines remains paramount when distributing these rewards. The distinction between a non-taxable gift and a taxable reward requires careful navigation. Cash prizes or near-cash equivalents, such as prepaid credit cards, are automatically classified as taxable income and require proper payroll deduction processing. Certain non-cash gift cards escape taxation provided the total value remains under the $500 annual limit, requiring operators to maintain immaculate logbooks detailing every distribution to survive potential audits. Failure to record these distributions correctly exposes the business to severe penalties and retroactive tax assessments.
Navigating the Payroll Remittance Labyrinth
Payroll compliance represents the most rigid and heavily penalised administrative duty for any employer. You bear the legal responsibility to deduct income tax, Canada Pension Plan contributions, and Employment Insurance premiums directly from employee compensation. The frequency of remitting these collected funds to the Receiver General relies on the Average Monthly Withholding Amount calculated from your history over the two calendar years prior.
The vast majority of small independent establishments fall into the Regular Remitter category, defined by an average monthly withholding amount below $25,000. Regular remitters must ensure the government receives deductions on or before the 15th day of the month following the payroll distribution.
New businesses or entities with extremely low payroll volumes, specifically an average monthly withholding amount below $3,000, qualify for Quarterly Remitter status. These employers submit deductions on April 15, July 15, October 15, and January 15. Maintaining quarterly status demands a perfect compliance record spanning the previous 12 months. The payroll account must exhibit zero late remittances, zero failure-to-deduct penalties, and no overdue T4 information returns. Simultaneously, the associated GST/HST account must show no outstanding balances or overdue filings.
Large-scale operations face hyper-accelerated timelines. Threshold 1 remitters, withholding between $25,000 and $99,999.99 monthly, remit twice per month. Funds deducted between the 1st and 15th fall due on the 25th of the same month. Funds deducted from the 16th onward fall due on the 10th of the subsequent month. Threshold 2 remitters, withholding $100,000 or more, operate on a four-period monthly schedule. They must remit funds electronically or in person at a financial institution within three working days following the end of the 7th, 14th, 21st, and final day of the month.
Navigating exact deduction amounts requires constant monitoring of legislative updates. For the 2026 tax year, the lowest federal tax bracket rests at 14 per cent for income under $58,523. Income spanning $58,523 to $117,045 faces a 20.5 per cent rate, ascending through higher tiers up to a maximum 33 per cent rate for income exceeding $258,482. Utilising automated calculation tools prevents deduction errors and subsequent compliance actions.
The Severe Cost of Payroll Compliance Errors
The penalty structure for late payroll remittances operates on a strict, graduated scale based entirely on the date of receipt, not the date you initiated the payment. Delays caused by bank processing times offer no protection against fines.
The Canada Revenue Agency enforces a strict penalty matrix. Payments received one to three days late incur a 3 per cent penalty. Four to five days late triggers a 5 per cent penalty. Six to seven days late results in a 7 per cent penalty. Any remittance delayed beyond seven days, or entirely ignored, faces a severe 10 per cent penalty. Repeat offences committed knowingly or under gross negligence double the penalty to 20 per cent of the outstanding amount. Furthermore, legislation mandates electronic payments for any remittance exceeding $10,000, assessing additional penalties for non-electronic submission.
Do not ignore this penalty schedule; late fees destroy margins rapidly. A $15,000 monthly payroll remittance arriving just eight days late instantly triggers a $1,500 penalty. The agency applies these fees ruthlessly. Accountific sets up your payroll correctly, ensuring you never face these avoidable fines.
Surviving the GST/HST Filing Matrix
Regulatory compliance consumes significant administrative bandwidth. Food businesses function as tax collection agents for the federal government, gathering GST/HST from patrons and remitting the funds to the agency. Establishments generating over $30,000 in gross revenue within four consecutive calendar quarters face mandatory GST/HST registration. Registered businesses calculate their net tax obligation by subtracting the Input Tax Credits, representing the GST/HST paid on business expenses, from the total GST/HST collected from consumers.
Filing deadlines depend heavily on the legal structure of the entity and the selected fiscal year-end. For corporate entities filing annually with a December 31 fiscal year-end, both the filing deadline and the payment deadline land exactly three months later, on March 31 of the following year. Sole proprietorships operating with a December 31 fiscal year-end follow a bifurcated schedule. The filing deadline extends to June 15, but the payment deadline remains strictly April 30. A common and costly error occurs when sole proprietors delay payment until the June 15 filing date, triggering immediate interest charges on the outstanding balance from May 1 onward. Non-calendar year-end corporations must file and pay three months following the conclusion of their specific fiscal year.
Quarterly installment payments present another layer of complexity. Businesses owing more than $3,000 in net tax for the previous year face mandatory quarterly installments. Each installment equals one-quarter of the prior year’s total net tax obligation. For a standard calendar year, these installments fall due on April 30, July 31, October 31, and January 31.
The penalties for non-compliance inflict severe financial damage. Late filing penalties feature a compound structure. The agency initially assesses a fine equal to 1 per cent of the total unpaid balance. The agency then adds an additional 0.25 per cent of the unpaid balance for every complete month the return remains overdue, up to a maximum of 12 months.
Consider a scenario involving a $50,000 tax obligation. If you file the return six months late, the agency assesses a massive penalty. The base penalty equals one per cent of the balance, resulting in a $500 fine. The agency adds an additional 0.25 per cent for each full month the return remains overdue. Six months multiplied by 0.25 per cent equals 1.5 per cent. This adds another $750 to the fine. The total penalty reaches $1,250. The agency then applies daily compounded interest at the prescribed rate of seven per cent to the entire outstanding balance.
Furthermore, electronic filing stands as a mandatory requirement for nearly all registrants for reporting periods ending in 2024 and beyond. Submitting paper returns triggers automatic penalties of $100 for the first offence and $250 for every subsequent paper filing. Accurate reporting remains equally enforced. Incorrectly reporting recaptured input tax credits or providing false statements yields penalties ranging from 5 per cent to 10 per cent of the erroneous amount, plus 1 per cent monthly until corrected.
Deconstructing the Accrual Illusion
Accrual accounting principles frequently create dangerous illusions of wealth for inexperienced operators. Tracking revenue based strictly on cash movement obscures impending financial obligations. Two prominent sources of this accrual illusion involve the sale of gift cards and the collection of catering deposits.
Gift card programs provide excellent marketing leverage and foster deep customer loyalty. The immediate transaction increases the business’s cash balance, creating a sensation of robust financial health, particularly during peak holiday seasons. This sudden cash influx does not constitute earned revenue. Accounting principles define unredeemed gift cards as deferred liabilities—a concrete promise to supply future goods and services. Treating this cash as immediate operating capital leads to severe liquidity crises during slower months when patrons return to redeem their cards. The business absorbs the food and labour costs associated with fulfilling the order without receiving any new cash flow at the time of service.
Navigating the tax implications of gift cards requires adherence to complex regulations. The Excise Tax Act and the Income Tax Act dictate specific treatments for the initial sale and subsequent redemption of these liabilities, including precise rules regarding breakage—the percentage of gift cards destined to remain permanently unredeemed. You must read our guide on how to implement a hidden cash flow strategy to handle these liabilities correctly.
Catering contracts introduce similar cash flow distortions. Large-scale event catering demands substantial upfront deposits to secure dates and finance initial ingredient purchases. Similar to gift cards, these deposits function as liabilities until the service delivery occurs. GST/HST obligations attach to these funds at the exact moment the deposit becomes legally non-refundable according to the signed contract, rather than at the date of the event. Misinterpreting this timeline forces operators to pay taxes out of pocket prematurely or face non-compliance penalties.
Post-event catering invoices frequently languish in accounts receivable for 30 to 60 days while corporate clients process the payments. An establishment viewing a massive catering contract on an income statement appears highly profitable on paper, yet struggles to meet the week’s payroll obligations due to a lack of liquidity. Continuous cash flow forecasting remains the sole defence against the accrual illusion.
Liquidity Ratios and Financial Health Indicators
Evaluating the immediate financial survival capacity of an establishment requires a focus on liquidity rather than mere profitability. Liquidity measures the capacity of the business to satisfy short-term obligations, such as supplier invoices, payroll liabilities, and utility bills, using assets readily convertible to cash.
The Current Ratio serves as the primary metric for short-term stability. The calculation involves dividing total current assets by total current liabilities. While traditional financial theory advocates for a ratio between 1.5 and 3.0, the unique cash flow dynamics of the hospitality sector generally yield lower figures. For domestic food businesses, a Current Ratio resting between 0.8 and 1.0 is standard. A ratio dipping significantly below 0.8 signals an imminent cash flow crisis, indicating insufficient capital to cover impending debts.
The Quick Ratio applies a much stricter standard by removing inventory from the calculation. The formula subtracts inventory value from current assets before dividing by current liabilities. This metric evaluates whether the business possesses the capital to pay immediate bills if all sales instantly ceased. Inventory sitting in walk-in coolers or dry storage represents trapped capital; the value remains inaccessible until a customer orders a meal. An establishment displaying a healthy Current Ratio of 1.5 alongside a Quick Ratio of 0.6 suffers from being inventory-rich and cash-poor, a highly vulnerable state. The target Quick Ratio is 1.0 or higher.
| Financial Metric | Mathematical Formula | Industry Target | Crisis Warning Sign |
| Current Ratio | Current Assets / Current Liabilities | 0.8 – 1.0 | < 0.8 |
| Quick Ratio | (Current Assets – Inventory) / Current Liabilities | 1.0+ | < 0.7 |
| Inventory Turnover | COGS / Average Inventory | 4 – 8 times / month | < 4 or > 8 |
| Gross Margin | ((Revenue – COGS) / Revenue) * 100 | 70% | < 65% |
| Net Margin | (Net Profit / Revenue) * 100 | 3% – 9% | < 2% |
Correcting liquidity issues demands aggressive operational changes. You negotiate extended payment terms with suppliers, shifting from net-30 to net-45 agreements to retain cash longer. Securing a business line of credit provides a vital safety net against unexpected revenue shortfalls. Monitoring table turnover rates directly influences liquidity. Calculating the number of parties served divided by the total available tables reveals dining room efficiency. Reducing ticket times and utilising handheld payment terminals accelerates table turns, directly increasing daily cash inflows.
Supply Chain Strategy and Operational Adjustments
Protecting profit margins against macroeconomic pressures necessitates ruthless operational audits. Deeply ingrained industry traditions frequently obscure massive financial inefficiencies. The standard practice of operating an establishment seven days a week serves as a prime example of structural vulnerability.
Financial analysis frequently reveals a significant disparity in profitability across different days of the week. Establishments routinely endure deeply unprofitable Mondays and Tuesdays, relying entirely on heavy volume during Friday and Saturday services to achieve overall weekly profitability. This model forces high-performing weekend shifts to subsidise the labour, utility, and food waste costs incurred during slow periods. Strategically closing the business on the two slowest consecutive days entirely eliminates the variable costs associated with those shifts, immediately elevating the overall net margin without requiring additional marketing expenditures.
Supply chain economics present another avenue for strategic adjustment. The farm-to-table movement transitioned from a niche marketing trend into a mainstream consumer expectation. Survey data reveal 86 per cent of domestic consumers actively seek locally produced food, with 74 per cent motivated by a desire to support the local economy. Furthermore, 60 per cent of consumers perceive local ingredients as inherently superior in freshness and quality. Establishing direct relationships with regional farmers reduces dependency on volatile international supply chains, mitigates the impact of import tariffs, and provides a compelling narrative to justify premium menu pricing.
Digital Visibility: Filling Tables with High-Intent Traffic
In an era dominated by digital discovery, visibility algorithms function as the modern storefront. Organic search traffic heavily influences consumer dining decisions. Analytical data indicates queries containing “restaurants near me” generate over 20 million impressions monthly. Understanding the underlying intent behind these queries determines the success of digital acquisition strategies.
Search intent categorises into four primary pillars. Informational Intent involves broad research, such as consumers inquiring about wine pairings or specific culinary techniques; these users seek knowledge rather than immediate reservations. Navigational Intent applies to users searching for a specific, known brand to find operating hours or physical addresses. Commercial Intent features comparative searches, such as users looking for the “best Italian restaurant” in a specific city, representing a critical battleground for local market share. Finally, Transactional Intent includes high-conversion queries containing words like “book table,” “reserve,” or “order delivery,” driving immediate, measurable revenue.
Capturing this traffic demands comprehensive local Search Engine Optimization (SEO). Optimising Google Business Profiles ensures accurate synchronisation of menus, operating hours, and location data across hundreds of digital directories. Geographic keyword targeting proves essential. Broad, high-volume generic keywords often fail to convert due to immense competition. Conversely, long-tail keywords featuring specific neighbourhood identifiers or niche culinary specialties drive highly qualified, low-competition traffic directly to the booking portal. A balanced strategy incorporating both broad commercial terms and hyper-specific local queries maximises digital footfall. Restaurants Canada data proves the battle for foot traffic continues to shift entirely online.
Defending Your Margins Against Regulatory Audits
The ultimate test of a financial architecture arrives during regulatory scrutiny. The Canada Revenue Agency actively targets the foodservice sector, employing aggressive net-worth audits designed to uncover unreported cash transactions. These audits reconstruct the personal financial standing of the business owner alongside the corporate accounts, searching for discrepancies between reported income and visible lifestyle expenditures.
Standard commercial insurance policies fail to shield operators from the financial devastation of non-compliance penalties or employment practices liability claims. Surviving regulatory scrutiny relies entirely on the implementation of proactive, digital financial systems. Relying on manual bookkeeping, faded paper receipts, and delayed data entry virtually guarantees catastrophic findings during an audit.
Modern operators digitise source documents instantly, categorising expenses into the segmented Chart of Accounts in real-time. By integrating point-of-sale data directly into cloud-based ledgers, operators establish an iron-clad, immutable record of every transaction. This systematic precision transforms tax preparation from an anxiety-inducing historical reconstruction into a controlled, routine administrative function. Clean, organised, and comprehensively documented financial records significantly reduce the duration and severity of agency examinations, safeguarding the long-term viability of the enterprise.
Achieving Absolute Financial Control
The trajectory of the Canadian food and beverage industry mandates a fundamental shift in management philosophy. Relying on intuition or top-line revenue figures guarantees operational failure in an environment defined by margin compression, intense regulatory oversight, and shifting consumer demands. Sustainable success requires absolute financial clarity, achieved only through rigorous structural design.
You must abandon generalised accounting practices in favour of hyper-segmented reporting models. Separating dine-in, takeout, delivery, and catering revenues into isolated streams exposes hidden inefficiencies and allows for rapid, precise corrective action. Mastery over Prime Costs through data-driven menu engineering and algorithmic labour scheduling defends the fragile net profit margin against relentless inflationary pressures. Flawless execution of administrative duties ensures the preservation of capital. Strict adherence to GST/HST filing deadlines, meticulous payroll deduction calculations, and timely remittances neutralise the threat of compounding interest and punitive agency fines.
Accountific provides the exact financial foundation required to implement these strategies. We pull you out of the spreadsheets and put you back on the restaurant floor. We handle the bookkeeping, the payroll, and the tax compliance, converting complex numbers into clear, actionable advice. The time has arrived to transform financial administration from a source of stress into a powerful tool for growth. Take the first step toward running a smarter, more profitable restaurant today. Book a Consultation at https://calendly.com/davidmonteith to regain complete control of your business.
David Monteith, founder of Accountific, is a seasoned digital entrepreneur and a Xero Silver Partner Advisor with over three decades of business management and financial expertise. He specialises in providing tailored Xero solutions for food and beverage businesses, streamlining accounting processes and delivering valuable financial insights that drive client success. David also serves as CFO of Great Work Online, a digital marketing agency serving food and beverage businesses, where he leads budgeting, financial oversight, and business management. This dual perspective gives Accountific clients more than bookkeeping mechanics — it brings a strategic view of how financial systems support better decisions, stronger operations, and long-term growth.