
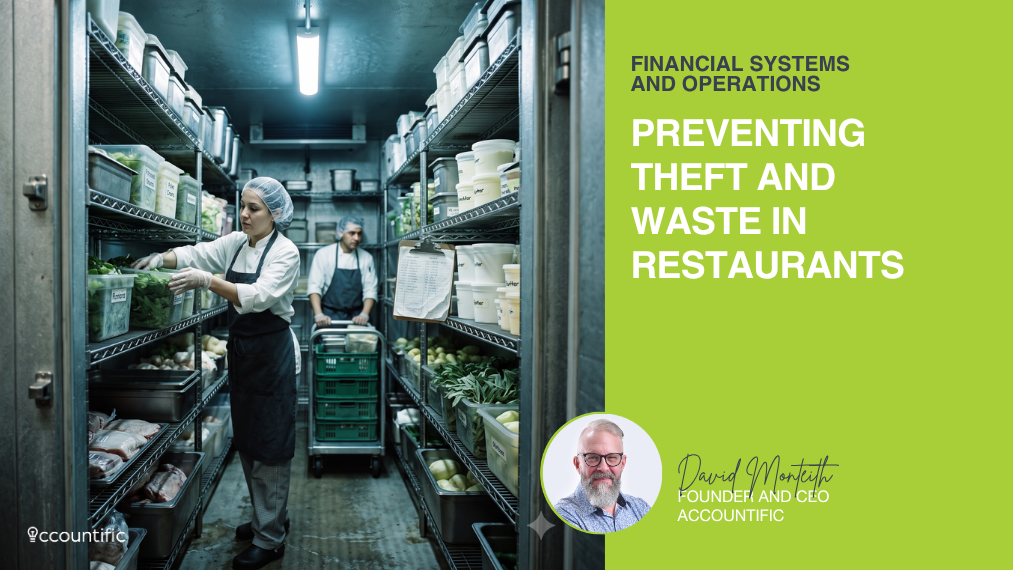
The COGS Split: Exposing Theft and Waste in Canadian Restaurants
TLDR
The average Canadian restaurant survived 2024 on an operating profit margin of 4.1 per cent. Sector-wide, operating revenue reached $99.6 billion against $95.5 billion in expenses, with cost of goods sold consuming 35.9 per cent of the total and wages taking another 33.6 per cent. Restaurants Canada has put roughly 62 per cent of establishments at a loss or barely breaking even.
At that margin, precision stops being an accounting preference and becomes a survival requirement.
The problem is that most operators track cost of goods sold as one consolidated figure. Food, draft, bottled beer, wine, spirits, non-alcoholic, and takeout packaging all report through a single line. Those categories carry wildly different margins and respond to entirely different pressures, so blending them produces a number that can flag a problem but never locate one. A spirits programme haemorrhaging product disappears behind a food programme running clean.
That blind spot is expensive. Industry research attributes roughly 75 per cent of inventory shortages to employee misconduct, with internal theft estimated at around 4 per cent of revenue. Set that against a 4.1 per cent margin and the arithmetic speaks for itself. Alcohol is the usual entry point, because it is high value, easy to move, and difficult to trace once poured.
Waste compounds it. Canadian restaurants discard about 3.2 million tons of food annually, worth roughly $4.4 billion, and close to 38 per cent of purchased produce never reaches a guest. Dairy loss runs near 21 per cent, meat around 20 per cent.
The corrective work is unglamorous, and it holds. Segment the cost ledger by category. Calculate theoretical pour cost from the sales mix and compare it to actual, treating variance under 1.5 per cent as normal and anything consistently past 2 per cent as a structural failure. Give packaging its own line so delivery reports its real margin. Track waste in four separate buckets rather than one. And keep inventory valuation compliant, because an unexplained shortage does not read as theft to a CRA auditor. It reads as unreported cash sales.
Why Read the Full Article
The summary establishes the exposure. The article supplies the working detail. It sets out the full category structure for a segmented cost ledger, the target COGS bands for fine dining, casual, and quick service, and pour cost benchmarks broken out across soft drinks, spirits, bottled beer, draft, and wine. It works through the theoretical-versus-actual variance calculation at the bottle level, the four waste categories and the specific operational owner attached to each, packaging cost as a percentage of revenue and its effect on delivery margin, and the CRA rules on inventory valuation under IT-473R, including why LIFO is prohibited and what the Tax Court decided in Yorkwest Plumbing Supply Inc.
How Accountific Helps
Managing granular financial data requires significant administrative effort and immense precision. If the ideas in this article feel like a lot to manage alone, there is a team doing this work every day for restaurants in Canada. Owners struggling with administrative burdens should visit Accountific for specialized financial support. To secure your margins and build a more resilient restaurant, book a consultation with us at https://calendly.com/davidmonteith.
The Financial Blind Spot of Blended Margins
Blended cost of goods sold figures hide financial variance. Many operators group all inventory purchases into a single, massive category. This aggregation creates a dangerous blind spot. Operators see a single large expense line on the income statement. When overall costs rise, the source remains completely invisible. Managers make guesses about the origins of the expense. The problem persists because the financial data lacks granularity.
Category-level cost lines transform vague problems into specific targets. Dividing expenses into food, beer, wine, liquor, non-alcoholic beverages, and packaging allows operators to compare each category against respective revenue streams. This separation highlights the exact location of a financial leak. This exact granularity helps you see exactly where your restaurant profits are leaking.
The granularity costs nothing to maintain once established. The initial effort pays dividends the first time the system catches a discrepancy. Blended metrics protect inefficiency and obscure mismanagement. Segmented categories expose errors. The bread and butter of your menu relies on precise measurement. A fuzzy cost problem becomes a specific leak for an owner to close.
Evaluating the Canadian Foodservice Financial Reality
The Canadian foodservice sector generates massive revenue while operating on razor-thin margins. According to Statistics Canada, operating revenue for the food services and drinking places subsector rose to $99.6 billion in 2024. Food and non-alcoholic beverage sales accounted for 86.5 per cent of total sales. Alcoholic beverages represented 11.0 per cent. Other sales made up the remaining 2.5 per cent.
Operating expenses for this subsector increased to $95.5 billion in 2024. The cost of goods sold remained the largest operating expense. This category accounted for 35.9 per cent of total expenses. Salaries, wages, commissions, and benefits followed closely at 33.6 per cent. Rental and leasing costs represented 8.1 per cent of expenses.
The resulting operating profit margin sat at a mere 4.1 per cent in 2024. With margins hovering near 4 per cent, any unmonitored expense directly threatens business survival. A one per cent increase in waste eliminates a quarter of the total profit. Restaurants Canada noted a massive surge in bankruptcies in 2023. At one point, 62 per cent of restaurants were operating at a loss or barely breaking even. These figures emphasize the urgent need for precise financial controls. You must get your ducks in a row to survive.
Operating revenue at limited-service eating places grew 7.7 per cent to $44.9 billion in 2024. Full-service restaurants increased 1.4 per cent to $44.2 billion. This shift marks the first year outside of the pandemic where limited-service establishments generated higher operating revenue than full-service counterparts. The relative performance of the two industry groups reflects consumers shifting toward lower-cost, convenience-oriented dining options amid continued price pressures. Understanding these shifts requires flawless bookkeeping.
The Staggering Financial Weight of Food Waste
Food waste represents a multi-billion-dollar drain on the industry. Globally, food services contribute about 26 per cent of all food waste. This equals roughly 338 million tons annually. In the United States, restaurants generate up to 33 billion pounds of food waste every year. The Canadian landscape shows equally alarming figures.
Canadian restaurants generate 3.2 million tons of food waste annually. This accounts for 9 per cent of all food waste in the country. The financial value of this waste reaches $4.4 billion every year. Restaurants in Quebec, Alberta, and British Columbia produce in excess of 100,000 tons of food waste annually.
According to recent research, 20 per cent of all food produced in Canada becomes avoidable loss. Within the food service sector, the proportion of purchased food becoming waste is significant. Data indicates waste accounts for 21 per cent of dairy, 38 per cent of produce, and 20 per cent of meat. The value of avoidable food waste amounts to 58 billion dollars every year across the entire Canadian supply chain.
Operators pay for discarded food three times. First, owners pay during the initial purchase. Second, owners pay for storage and preparation labour. Third, owners pay disposal fees. Plate waste is a major contributor, as noted in the BC Government food service toolkit. Uneaten portions indicate excessive serving sizes. While large portions occasionally form part of a brand identity, unfinished meals represent an investment yielding zero return. Reducing portion sizes lowers the cost of goods sold and disposal fees simultaneously.
To combat excessive spoilage and loss, managing your inventory to track food waste across four primary categories is essential. Spoilage occurs when ingredients expire before use. Plate waste happens when customers leave food behind due to large portion sizes. Preparation waste stems from kitchen mistakes and unnecessary trimmings. Over-ordering leaves stock unused in storage, tying up critical cash flow. Measuring these specific categories provides actionable targets for kitchen managers. The numbers do not lie. When a manager ignores portion control, the kitchen bleeds profit.
Exposing the Silent Threat of Internal Employee Theft
External threats often dominate discussions regarding theft. Operators worry about break-ins and dine-and-dash incidents. Shoplifting and public disorder present genuine challenges. Conversely, internal theft creates financial losses, proving much harder to detect.
The Retail Council of Canada reported that retail theft and shrinkage reached 9.1 billion dollars in 2024. This figure represents approximately 1.5 per cent of total retail sales. Internal theft remains a significant contributor alongside administrative errors and process failures. In the hospitality sector, the numbers appear more severe. The US National Restaurant Association found that 4 per cent of all revenue is lost to in-house theft. Applying this metric to the Canadian average profit margin of 4.1 per cent reveals a devastating reality. Internal theft essentially erases the entire profit margin.
Employee misconduct accounts for 75 per cent of inventory shortages. Alarmingly, 75 per cent of employees admit to stealing from the workplace at least once. Theft extends far beyond slipping cash from the register. Misconduct includes fraudulent refunds, inventory manipulation, unauthorized discounts, misuse of company resources, and time theft. Weak controls and inconsistent oversight enable dishonest behaviour to go unnoticed. Employees understand inventory systems and security measures, making internal theft difficult to identify until losses become massive. The greatest cost of employee theft involves the erosion of trust, accountability, and operational confidence across the organization.
Tip theft presents another legal and operational hazard. Some businesses implement policies where managers retain portions of gratuities. The Workers’ Action Centre in Halifax actively targets employers grabbing worker gratuities. Canada lacks federal tip-protection laws, leaving regulation to provincial jurisdictions. Employees file hundreds of complaints regarding tip theft across the country. Ontario and British Columbia prohibit employers from claiming tips unless they directly participate in customer service. Prince Edward Island, Quebec, and Newfoundland and Labrador prohibit employers from withholding tips completely. Establishments engaging in tip theft risk severe reputational damage, low staff morale, and harsh legal action.
The Devastating Impact of Unchecked Liquor Variance
Alcohol theft presents a particularly severe risk for restaurants in Canada. Bartenders give away complimentary drinks to friends. Staff consume alcohol during shifts. Bartenders intentionally over-pour drinks to secure larger tips. These actions force the restaurant to continually replace missing stock.
The costs extend beyond the missing bottle. When employees steal alcohol, the resulting inventory gap indicates unreported sales to auditors. Without proof of theft, an auditor assumes the missing alcohol was sold and the cash pocketed. The business faces reassessments for sales tax on the unreported sales. Penalties and interest follow immediately. This represents substantial costs; the theft of a single bottle ends up costing exponentially more than the replacement price.
To prevent catastrophic audits, operators must understand these vulnerabilities. You must build a robust defence. We highly recommend you read our comprehensive guide to help secure your margins against CRA scrutiny. The Canada Revenue Agency employs data-driven methods to identify these specific inventory gaps. Precise categorization of beverage costs shields the business from unwarranted penalties.
Establishing Precise Cost of Goods Sold Benchmarks
To combat waste and theft, operators must implement a segmented chart of accounts. This strategy separates the cost of goods sold into highly specific categories. A fuzzy cost problem transforms into a specific, manageable target. Benchmarking against industry standards provides a vital health check for the business.
Food costs vary significantly based on the type of establishment. Fast food restaurants typically maintain food costs between 28 and 32 per cent. Fine dining restaurants experience higher costs, generally falling between 35 and 40 per cent. Premium ingredients and complex preparation drive these elevated percentages. Casual dining establishments aim for 30 to 35 per cent. Cafes and coffee shops enjoy the lowest food costs, ranging from 20 to 25 per cent. Pizzerias benefit from low-cost base ingredients like dough, sauce, and cheese, resulting in a 20 to 28 per cent range. Cloud kitchens must account for platform commissions and packaging, aiming for 25 to 28 per cent.
| Venue Type | Typical COGS Range | Commentary |
| Cafes and Coffee Shops | 20% – 25% | Beverages offer low food cost; food items balance the metric. |
| Cloud Kitchens | 25% – 28% | Simple recipes compensate for high packaging and platform fees. |
| Pizzerias | 20% – 28% | Low-cost base ingredients create favourable percentages at scale. |
| Fast Food | 28% – 32% | Simple recipes and low overhead compensate for competitive pricing. |
| Casual Dining | 30% – 35% | Broadest segment balancing fresh ingredients and prepared items. |
| Fine Dining | 35% – 40% | Premium ingredients offset by higher check averages. |
These benchmarks guide menu pricing strategies. Knowing the correct benchmark helps identify cost-saving opportunities and prevents menu underpricing.
Deconstructing Beverage and Pour Cost Targets
Beverage costing evaluates the percentage of revenue supporting liquid inventory. Segmenting beverages is crucial because profit margins differ wildly among categories. Combining draft beer and premium spirits into a single ledger line obscures true profitability.
Draft beer carries the highest margin of any beverage. A good pour cost for draft beer ranges from 15 to 25 per cent. Brewery taprooms achieve the lowest costs, often hitting 15 to 20 per cent by eliminating distributor markups. Casual dining restaurants target 26 to 30 per cent for draft beer. Bottled beer typically runs between 24 and 28 per cent.
Spirits and cocktails generate exceptional profits. The benchmark for liquor sits between 18 and 22 per cent. Nightclubs operating in high-volume environments target 18 to 22 per cent pour costs. Dive bars target 22 to 26 per cent, offering lower retail prices but benefiting from lower operating costs.
Wine carries a higher cost percentage, generally ranging from 30 to 45 per cent, depending on whether the sale is by the glass or bottle. Non-alcoholic soft drinks provide the highest margin, requiring only 6 to 8 per cent of revenue to maintain.
| Beverage Category | Typical Pour Cost | Commentary |
| Soft Drinks | 6% – 8% | Exceptional margin; high volume driver. |
| Brewery Taproom Draft | 15% – 20% | Eliminates distributor markups completely. |
| Liquor / Spirits | 18% – 22% | High profitability; highly susceptible to over-pouring. |
| Bottled Beer | 24% – 28% | Consistent cost; lower risk of shrinkage. |
| Casual Dining Draft Beer | 26% – 30% | Highest margin beverage despite smaller share of total revenue. |
| Wine | 30% – 45% | Higher cost percentage; driven by premium bottle pricing. |
Creating a pour policy sets clear standards for the number of ingredients used in each cocktail. Encouraging the use of measuring tools like pouring spouts and jiggers ensures absolute precision to secure your beverage margins.
Diagnosing Variance Through Theoretical Versus Actual Pour Costs
Granular categorization enables a critical financial analysis. Operators must measure the variance between theoretical and actual pour costs.
Theoretical pour cost represents the exact amount the bar should have spent based on the drinks sold. This calculation assumes perfect execution. Every drink follows the exact recipe. Zero spills occur. Bartenders pour zero unauthorized complimentary drinks. The theoretical cost derives directly from the sales mix and specific recipe costs.
Actual pour cost reflects the true expenditure. This number comes directly from invoices and physical inventory counts at the end of the month or week.
The gap between theoretical and actual costs is the variance. This variance metric serves as the ultimate diagnostic tool for any bar program. An acceptable variance threshold falls between 0.5 and 1.5 per cent. A consistent variance exceeding 2 per cent signals immediate operational failure. This massive gap indicates over-pouring, spillage, incorrect pricing, theft, or a failure to ring up sales.
Many independent bars attempt to manage pour costs through verbal motivation. Managers remind staff about pouring standards. The actual pour cost drops for three weeks. Then, the number inevitably drifts upward again. Verbal motivation changes behaviour temporarily. Structured measurement holds behaviour accountable permanently, which reveals the real reason your pour cost is high. By calculating variance monthly or weekly, operators pinpoint specific issues and implement targeted corrective measures. Identifying the exact variance on a single bottle of premium vodka pinpoints the precise location of the theft.
Isolating Packaging Costs to Protect Delivery Margins
The rise of off-premise dining necessitates tracking packaging as a distinct cost category. Bundling packaging expenses into general food costs distorts profitability metrics. Packaging requires a separate, dedicated ledger line.
Most industry benchmarks place packaging costs between 1 and 3 per cent of total revenue. A takeout-heavy operation occasionally reaches 6 per cent. If packaging expenses exceed 3 per cent in a standard dine-in environment, the operator must consolidate suppliers and buy in larger quantities.
In the current Canadian market, the true cost of packaging includes environmental taxes, waste disposal fees, and consumer perception. Traditional plastics historically cost around $0.05 per unit. Modern environmental alternatives, such as bagasse and kraft paper, cost between $0.20 and $0.50 per unit. Increased competition among Canadian wholesalers has closed the pricing gap. Eco-alternatives now sit within 5 to 10 per cent of traditional plastic prices.
Delivery channel gross margin gaps often fall 15 to 25 percentage points below dine-in margins. The actual figure depends on fee structures, menu mix, and packaging costs. Factoring in these costs into specific menu items ensures delivery channels remain profitable. Operators must estimate the average packaging cost per order and add the expense directly to each dish’s plate cost.
Navigating Canada Revenue Agency Inventory Valuation Guidelines
Accurate inventory accounting directly impacts reported profit, tax obligations, and cash flow. The Canada Revenue Agency enforces strict rules regarding inventory valuation.
For income tax purposes, the Canada Revenue Agency accepts two primary methods of valuing inventory. The first method evaluates the fair market value of the entire inventory. The second method values individual items at their cost or their fair market value, whichever is lower.
This method aligns perfectly with the physical movement of perishable goods in a restaurant. The First In, First Out method assumes the oldest inventory sells first. When ingredient prices rise due to inflation, First In, First Out results in a lower cost of goods sold and a higher reported profit.
The Weighted Average method calculates an average cost across all units in stock. This method smooths out price fluctuations over time. Specific Identification tracks the actual cost of each individual item. This approach works best for high-value items, such as vintage wines or premium spirits.
The Last In, First Out method assumes the newest inventory sells first. During inflationary periods, this method leads to a higher cost of goods sold and lower taxable income. For this exact reason, the Canada Revenue Agency explicitly prohibits the Last In, First Out method. Accounting standards in Canada severely restrict these methods. International Financial Reporting Standards and Accounting Standards for Private Enterprises also ban this practice.
The Canada Revenue Agency requires consistency. Operators must use the same inventory valuation method from year to year to follow standard CRA guidelines (IT-473R). Intentional adjustments to fix unintentional understatements often face denial by the Canada Revenue Agency. In the case of Yorkwest Plumbing Supply Inc., a Canadian-controlled private corporation attempted a compensatory adjustment for previous inventory tracking errors. The Canada Revenue Agency denied the adjustment. The Tax Court of Canada dismissed the subsequent appeal, reinforcing strict adherence to the Income Tax Act. Recording a loss on an inventory account to preserve a regular profit margin for a subsequent year remains completely unacceptable under standard IT-473R: Inventory Valuation directives.
Managing these complex regulations requires professional expertise. Attempting to navigate the tax code alone leads to severe financial distress. Operators must realize the danger of handling complex reconciliations without expert support. We urge operators to read Stop the DIY Restaurant Bookkeeping Trap: Pivot from Paperwork to Profits to understand the true cost of amateur financial management.
Defending Your Profit Margin Against Aggressive Audits
The Canada Revenue Agency actively targets the foodservice sector. Cash transactions and complex inventory movements make restaurants prime candidates for audits. A lack of financial clarity exposes operators to aggressive scrutiny.
When inventory counts fall out of balance due to internal theft or waste, the Canada Revenue Agency assumes the missing product generated unreported cash revenue. The resulting penalties prove devastating. A net worth audit examines the personal assets of the restaurant owner. If personal wealth increases faster than reported income allows, the auditor assumes the restaurant hides cash.
Proper bookkeeping serves as the ultimate defence. Professional financial administration ensures every invoice, voided ticket, and inventory count aligns perfectly. This meticulous record-keeping halts an audit in the preliminary stages. The financial administration of a food business requires specialized knowledge and constant vigilance.
Confronting External Pressures from Crime to Inflation
Beyond internal operations, Canadian restaurants face severe macroeconomic pressures. Understanding these external forces highlights the absolute necessity of internal financial control.
The Canadian Federation of Independent Business reports that crime and safety issues directly affect nearly half of all small businesses. Vandalism, theft, and waste force business owners to spend a median of $5,000 on crime-related expenses over a three-year period. In British Columbia, 57 per cent of small businesses reported direct impacts from crime in 2024. Half of Canadian small business owners report rising crime in their community over the past year.
Many owners choose to ignore the insurance process. Sixty-eight per cent of small firms consistently refuse to file crime-related insurance claims. Often, policies have gaps that leave owners vulnerable. To verify your coverage, review Are You Exposed? 7 Hidden Insurance Gaps Costing Canadian Restaurants. Owners fear driving their insurance premiums higher during a period of escalating costs. Inflation compounds these security costs, directly impacting the operating budget. Some business owners report spending thousands of dollars installing security cameras and replacing smashed windows.
Inflation compounds these security costs further. The food purchased from restaurants component of the Consumer Price Index grew 3.6 per cent in 2024, outpacing the all-items index. Operators face higher production costs, increased raw material prices, and rising wages.
Federal and provincial policies add further strain. The alcohol excise tax continually threatens beverage profit margins, according to a recent Lightspeed HQ report. Additionally, provincial sales tax structures occasionally disadvantage small operators. In Manitoba, the Canadian Federation of Independent Business recently protested a grocery tax exemption applying only to large grocery stores. Small retailers and restaurants remained obligated to charge the tax on identical prepared items, resulting in a targeted CFIB petition. This two-tier system shifts sales away from local businesses already struggling with immense cost pressures.
These combined pressures result in alarming insolvency rates. A recent survey revealed 36 per cent of operators are operating at a loss or breaking even, tripling the levels seen in 2019. Quick-service restaurants face the hardest conditions, with 81 per cent reporting declining profitability.
Transforming Administration into Actionable Intelligence
Surviving these immense pressures requires absolute financial control. Owners must transition away from gut-feel management. Successful operators rely on proactive and timely data to steer the business.
Accountific provides the specialized expertise necessary for this transition. The team lives and breathes restaurant finances. By providing weekly bookkeeping, Accountific ensures owners possess a current, accurate picture of their financial health. This frequency enables agile decision-making, allowing operators to adjust pricing or portions long before a catastrophic loss occurs.
The Accountific process follows a logical four-step journey. First, operators book a consultation to outline unique challenges. Second, the team sets up a clean, efficient accounting system, fixing previous errors and building a structured chart of accounts. Third, automation technology makes data collection seamless, eliminating the need to hunt for faded receipts. Finally, the owner achieves absolute control. Through weekly reporting and expert support, the owner sits firmly in the driver’s seat.
This comprehensive service covers bookkeeping, payroll, and tax compliance. Managing payroll, issuing T4 documents, and preparing Records of Employment create massive time burdens. Accountific acts as a single, trusted partner to eliminate these distractions. The service turns raw data into actionable insights, providing detailed menu engineering reports pulled directly from point-of-sale systems.
Securing Your Financial Future Today
Category costing changes the trajectory of a food business. Separating the cost of goods sold into distinct categories reveals the exact location of waste and theft. Monitoring the variance between theoretical and actual pour costs ceases inventory leakage immediately. Aligning inventory valuation with Canada Revenue Agency guidelines prevents devastating audit penalties. The math is not rocket science, but the execution requires absolute dedication.
Operators trying to manage these complex metrics independently often fail. The task demands specialized knowledge and constant attention. Delegating this burden to experts provides immediate relief and long-term stability. Your time and energy are better spent developing staff, planning the next menu item, and greeting customers.
Accountific provides the essential financial foundation to implement these strategies. The team helps passionate entrepreneurs gain absolute control of their finances. This control reduces stress and builds more profitable businesses. The path to financial clarity begins with a simple conversation. Schedule a consultation at https://calendly.com/davidmonteith to build a smarter, more resilient restaurant today.
David Monteith, founder of Accountific, is a seasoned digital entrepreneur and a Xero Silver Partner Advisor with over three decades of business management and financial expertise. He specialises in providing tailored Xero solutions for food and beverage businesses, streamlining accounting processes and delivering valuable financial insights that drive client success. David also serves as CFO of Great Work Online, a digital marketing agency serving food and beverage businesses, where he leads budgeting, financial oversight, and business management. This dual perspective gives Accountific clients more than bookkeeping mechanics — it brings a strategic view of how financial systems support better decisions, stronger operations, and long-term growth.