Stop Running Your Restaurant on Gut Feel
You make a hundred decisions a day based on instinct. You know when the kitchen is in the weeds just by the sound. You can feel the energy of the dining room. Your gut has gotten you this far, and it’s an essential tool for any restaurateur. But it cannot tell you if you are about to run out of cash.
The reality for restaurants in Canada is tougher than ever. In 2024, restaurant bankruptcies surged by 30 percent. As of mid-2025, reports showed that a staggering 41 percent of restaurants were operating at a loss or just breaking even. This is not an environment where you can afford to guess. The margin for error is gone. High food and labour costs are squeezing you from one side, while customers facing their own financial pressures are dining out less and hunting for value on the other. This is a pressure cooker, where one bad day can put you out of business. A simple decision, like a menu-wide price increase to cover costs, could backfire and drive away the very customers you need to survive.
This is where financial ratios come in. Think of them not as complicated accounting homework, but as the simple, clear dashboard for your restaurant’s engine. They are the gauges and warning lights that tell you about a small oil leak before the engine seizes. Understanding these numbers is no longer just good practice for growth; it is a fundamental requirement for survival. They allow you to shift from making reactive, gut-feel decisions to proactive, strategic ones that will protect your business.
The Liquidity Check: Can You Cover Next Month’s Bills?
Liquidity is about one thing: your ability to pay your short-term bills. It answers the most stressful question any owner faces: “Do I have the cash to make payroll on Friday and pay my produce supplier next week?” This is about immediate financial survival.
The Current Ratio: Your One-Year Financial Cushion
The current ratio is a broad look at your financial health over the next 12 months. It measures your ability to pay off all your short-term debts with the assets you expect to convert to cash within that year.
The formula is simple:
Current Ratio = Current Assets ÷ Current Liabilities
A result above 1.0 suggests you have more assets than liabilities, which is a good sign. Many analysts look for a ratio between 1.5 and 3.0, but for restaurants in Canada, the reality is often different. A number below 1.0 is a clear warning that you could face trouble meeting your obligations in the coming year.
The Quick Ratio (Acid-Test): Your 90-Day Survival Metric
Now for the number that really matters for a restaurant. The quick ratio, or acid-test, is a much stricter and more realistic measure of your immediate liquidity. It answers the question, “If my sales stopped tomorrow, could I pay my upcoming bills without having to sell a single steak or bottle of wine?”
The formula removes inventory from your assets:
Quick Ratio = (Current Assets – Inventory) ÷ Current Liabilities
Why is this so critical for you? Because your inventory, that walk-in full of fresh produce, dairy, and meat, is not a liquid asset. You cannot easily sell it to a third party to raise cash for an emergency repair or a missed tax remittance. Its value is locked up until a customer orders it. The quick ratio gives you a true picture of your cash-on-hand health. A ratio of 1.0 or higher is the goal; it means you have at least one dollar in easily accessible cash for every dollar of debt coming due in the next 90 days.
A healthy current ratio can dangerously mask a critical cash flow problem. You might have a current ratio of 1.5, thinking you are safe, but a quick ratio of 0.6, which signals immediate danger. This means your capital is trapped on your shelves as perishable inventory instead of sitting in your bank account, ready to pay your bills. You are “inventory-rich and cash-poor.” Calculating these ratios requires an accurate, up-to-date balance sheet, the kind of financial discipline that also helps you determine if your restaurant could survive a CRA audit. Gut feel will not tell you this. That is why Accountific provides weekly bookkeeping. You always have a clear picture of your liquidity, so you can make decisions to improve cash flow before it becomes a crisis.
The Profitability Check: Are Your Menu and Your Business Actually Making Money?
Once you know you can survive the next month, you need to know if your business is built for the long term. Profitability ratios tell you whether your hard work is actually translating into money you can keep.
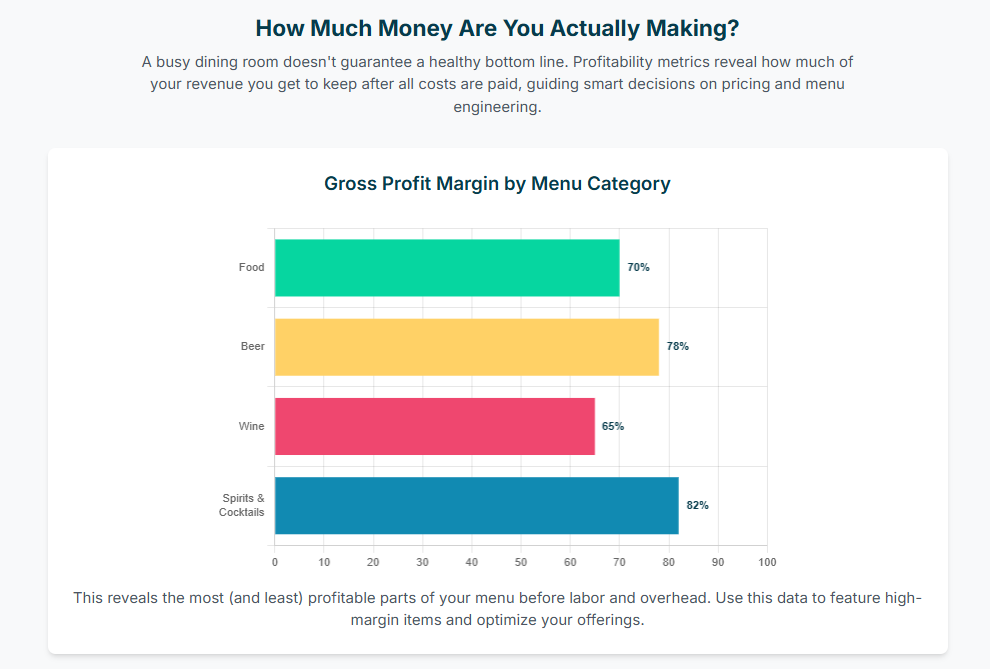
A busy dining room doesn’t guarantee a healthy bottom line. This chart breaks down the gross profit margin for key menu categories, revealing that Spirits & Cocktails (82%) offer the highest return. Use this data-driven insight to strategically price your menu and feature your most profitable offerings.
Gross Profit Margin: The Report Card for Your Menu
Your gross profit margin tells you how profitable your menu is. It is the percentage of revenue you have left after paying for the ingredients, or the Cost of Goods Sold (COGS). This is what is left over to pay for everything else: your staff, your rent, your utilities, and hopefully, yourself.
The formula is:
Gross Profit Margin = ((Revenue – COGS) ÷ Revenue) x 100
For many restaurants, a healthy gross profit margin is around 70 percent. If you sell a burger for $20, this means you have $14 left after paying for the patty, bun, and toppings. If your gross margin is low, it is a direct sign that your food costs are too high relative to your menu prices.
Net Profit Margin: The Real Bottom Line
This is the number that matters most. Your net profit margin is the percentage of total revenue you get to keep after every single expense has been paid. It is the ultimate measure of your restaurant’s financial success.
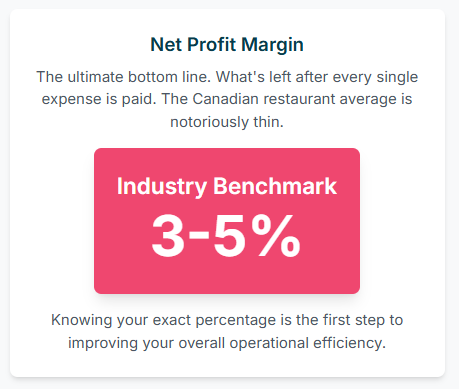
With the average Canadian restaurant’s net profit margin hovering between a razor-thin 3-5%, there is no room for error. This single number is your ultimate report card, knowing it is the first step to controlling costs and building a truly profitable business.
The formula is:
Net Profit Margin = (Net Profit ÷ Revenue) x 100
The average net profit margin for full-service restaurants in Canada is painfully thin, often landing between 3 and 5 percent. In fact, Statistics Canada reported the average operating profit margin for the food services subsector was just 3.6 percent in 2023, the lowest it has been since 2003. This razor-thin margin shows why every dollar counts. It forces you to find profit everywhere, from developing an event goldmine to learning how to earn an extra $15,000 from your patio.
Many owners fall into a trap. They achieve a strong gross profit margin of 70 percent and think their menu is a success. Yet, at the end of the month, there is no money left in the bank. This disconnect happens when operational costs, primarily labour and rent, are out of control and consuming every dollar of profit generated by the food. Your menu can be healthy, but your business can be dying. To calculate these margins accurately, you need every single expense categorized correctly, from the cost of cilantro to your payroll remittances. We handle that for you, providing clear, weekly Profit & Loss statements. This gives you the clarity to see if it is your menu or your operations that need attention, so you can stop guessing and start fixing.
The Efficiency Check: Where Are Your Operations Leaking Cash?
Inefficiency is a silent profit killer. It shows up as food waste, overstaffing, and empty tables during a dinner rush. Efficiency ratios connect your day-to-day operations directly to your financial results, showing you where you are leaking cash.
Inventory Turnover: Your Walk-In Fridge’s Performance Review
This ratio measures how many times you sell through your entire inventory in a given period, like a month. It is a powerful indicator of your purchasing efficiency, inventory management, and food waste control.
The formula is:
Inventory Turnover = COGS ÷ Average Inventory
A good target for many restaurants is to turn inventory 4 to 8 times per month. A number below 4 suggests you are overstocking. That ties up your cash in the walk-in and increases the risk of spoilage, which drives up your food costs. A number above 8 could mean you are ordering too little, too often, and risk running out of key ingredients during a busy service.
Table Turnover: Maximizing Your Most Valuable Asset
Your tables are your revenue-generating machines. The table turnover rate measures how many times a table is seated with a new party during a specific service period.
The formula is:
Table Turnover Rate = Number of Parties Served ÷ Number of Available Tables
There is no single ideal number; a quick-service lunch spot will have a much higher turnover than a fine-dining restaurant. The goal is to track your own rate and find ways to improve it without making guests feel rushed. A small improvement, like shaving 10 minutes off the average table time during your busiest two hours, can lead to one extra turn per table, which can have a massive impact on your nightly revenue.
These efficiency metrics are not just numbers on a page; they are directly linked to your financial health. Poor inventory turnover, for example, creates a vicious cycle. It ties up cash, which hurts your quick ratio. It leads to more food waste, which increases your COGS and kills your profit margins. A single operational problem creates a downward financial spiral. You are too busy running the floor to manually track every case of tomatoes. Our process helps automate data collection from your POS and supplier invoices. We turn that data into simple reports, so you can easily spot a declining inventory turnover rate and adjust your ordering before it drains your cash and kills your profit margin.
Your Numbers in the Real World: Benchmarking for Restaurants in Canada
A ratio by itself is just a number. To give it meaning, you need context. You must compare it to industry benchmarks and, most importantly, to your own past performance. Comparing your fine-dining establishment to a fast-food chain is useless. The real power comes from tracking your own ratios month after month to spot trends before they become problems.
Here is a quick reference guide for typical benchmarks for restaurants in Canada.
| Ratio Name | Formula | What It Measures | Canadian Benchmark |
| Quick Ratio | (Current Assets – Inventory) / Current Liabilities | Ability to pay immediate bills without selling food | Aim for 1.0 or higher |
| Current Ratio | Current Assets / Current Liabilities | Short-term (1-year) financial stability | Often below 1.0 for restaurants; 0.8-1.0 is common |
| Net Profit Margin | (Net Profit / Revenue) x 100 | The true bottom-line profitability of the business | 3-5% for full-service; 6-9% for QSR |
| Gross Profit Margin | ((Revenue – COGS) / Revenue) x 100 | The profitability of your menu items | Aim for ~70% |
| Inventory Turnover | COGS / Average Inventory | How efficiently you use and purchase inventory | 4 to 8 times per month |
From Red Flags to a Real Plan: What to Do When Ratios Signal Trouble
Seeing a red flag is the first step. Taking action is what saves your business. The solutions to poor financial ratios are almost always found in operational improvements, not abstract financial tricks. Fixing the numbers means fixing the kitchen, the schedule, and the menu.
If Liquidity is Low (Poor Current/Quick Ratios)
A low quick ratio means you need cash, fast. Start by reviewing your payment terms with suppliers. Can you negotiate for net-45 instead of net-30 to give yourself more breathing room?. If you have corporate clients, ensure you are invoicing and collecting payments promptly. For a short-term buffer, a business line of credit can be a crucial safety net.
If Profitability is Suffering (Poor Gross/Net Margins)
If your gross margin is low, your menu needs work. This is where menu engineering is essential. Analyze your sales data to classify every item into one of four categories:
- Stars: High profit, high popularity. Protect and promote these items.
- Puzzles: High profit, low popularity. Tweak the description, move it to the menu, or have servers recommend it.
- Plow Horses: Low profit, high popularity. These are customer favourites that do not make you much money. Cautiously increase the price or slightly reduce the portion cost.
- Dogs: Low profit, low popularity. Remove these from your menu. They are costing you money and taking up valuable space.
If your net margin is low but your gross margin is healthy, the problem is your operating costs. Your two biggest expenses are food and labour, together known as prime costs. You must get your labour costs under control through smart, data-driven scheduling that matches staffing levels to your sales forecasts.
If Efficiency is Poor (Poor Turnover Ratios)
A low inventory turnover points to waste and tied-up cash. Implement a strict “First-In, First-Out” (FIFO) system to ensure older stock is used first. Use your POS data to improve your sales forecasting so you can order more accurately. A low table turnover means your dining room is not working hard enough. Analyze your ticket times. Can you streamline your menu to reduce prep times for popular dishes? Can you use handheld POS terminals to take orders and payments at the table, speeding up the process?
You cannot engineer your menu if your sales data is a mess. You cannot create a smart schedule if you do not know your true labour cost percentage week by week. Accountific organizes all this data into easy-to-read reports. We give you the financial clarity you need to make these smart operational decisions and gain control over your profitability.
Take Control of Your Financial Future
These ratios are the language of your restaurant’s financial health. When you learn to read them, you stop reacting to crises and start preventing them. You move from being an overwhelmed operator, pulled in a dozen directions, to being the confident CEO of your business. This is what control feels like.
Gaining that control requires a solid financial foundation. You need accurate, timely bookkeeping. You need a seamless payroll that keeps you compliant. You need to know your tax obligations are handled so you can focus on your craft. That is the foundation Accountific provides. We give you the clear data, the expert support, and the time back in your day to use these ratios to build a stronger, more stable, and more profitable restaurant.
It is time to take control. Book a no-obligation consultation with Accountific today, and let’s build a more profitable future for your restaurant, together.
——————–
David Monteith, founder of Accountific, is a seasoned digital entrepreneur and a Xero Silver Partner Advisor. Leveraging over three decades of business management and financial expertise, David specializes in providing tailored Xero solutions for food and beverage businesses. His deep understanding of this industry, combined with his proficiency in Xero, allows him to streamline accounting processes, deliver valuable financial insights, and drive greater success for his clients.